Homepage Blank Venn Diagram Graphic Organizer PDF Template
Navigation

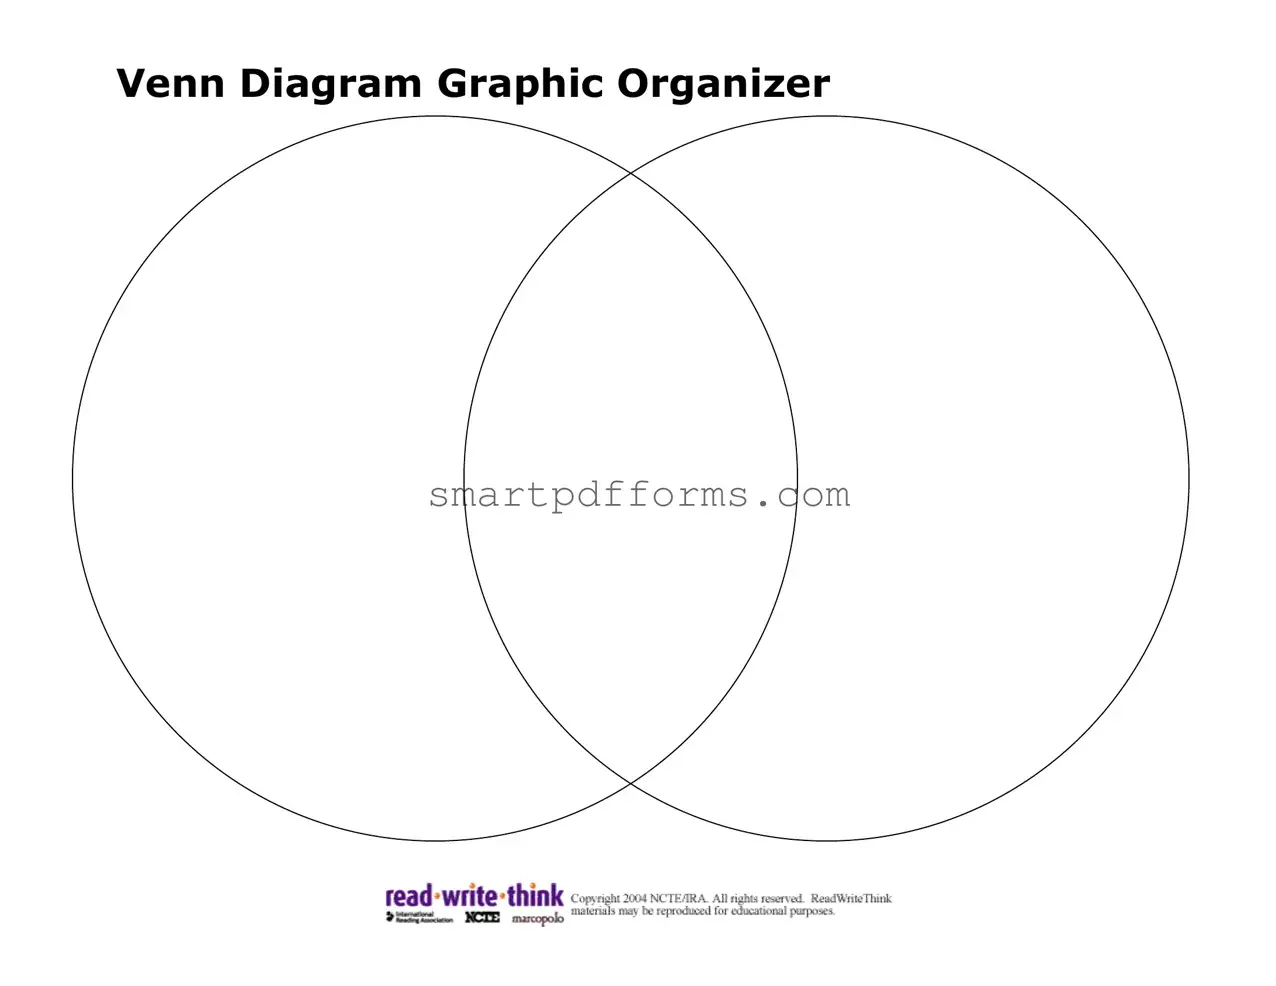
The Venn Diagram Graphic Organizer form stands as a versatile tool designed to facilitate structured analysis and comparison of various concepts, ideas, or entities in an educational setting or beyond. This form, embodying simplicity and effectiveness, allows users to visually organize information into overlapping circles, thus making the identification of similarities and differences more intuitive and insightful. These organizers are widely utilized across different disciplines, from mathematics to literature, signifying their adaptability and the value they add in fostering critical thinking and analytical skills. By offering a clear and straightforward platform, the Venn Diagram Graphic Organizer form aids in enhancing comprehension, promoting effective communication of ideas, and supporting the synthesis of information from multiple sources. Its utility in both academic and professional realms underscores its importance as a tool for clearer thinking and decision-making.

Preview - Venn Diagram Graphic Organizer Form

Venn Diagram Graphic Organizer

Form Data

Fact Name Detail
Purpose Used to visually organize information to highlight similarities and differences between two or more items.
Components Typically consists of overlapping circles, each representing a set of traits or ideas.
Functionality Enables users to identify shared and distinct characteristics easily.
Application Widely used in educational settings, brainstorming sessions, and for comparative analysis in various fields.
User-friendly Designed to be straightforward and intuitive for users of all ages and backgrounds.
Customization Can be tailored with additional circles and annotations to suit complex comparisons.
Governing law Not governed by specific laws as it is a universal tool used for organizing information rather than a legal document.

Instructions on Utilizing Venn Diagram Graphic Organizer

Crafting a Venn Diagram Graphic Organizer allows individuals to visually dissect and compare distinct elements, ideas, or information. It helps to outline similarities and differences clearly, making complex information more digestible. The form typically consists of two overlapping circles, where each circle represents a set of items or ideas. The overlapping section is reserved for items that the sets have in common. Following a step-by-step guide ensures the organizer is filled out effectively and serves its purpose of simplifying comparison.

  1. Identify the two subjects, ideas, or sets of items you wish to compare. Write one subject at the top of the left circle and the other at the top of the right circle.
  2. List down the unique attributes, characteristics, or elements of the first subject inside the left circle but outside the overlapping area.
  3. Similarly, within the right circle and outside the overlap, note the unique attributes of the second subject.
  4. In the overlapping area of the two circles, jot down the similarities or common traits between the two subjects.
  5. Review the organizer to ensure all relevant information has been captured. It may be helpful to ask whether there are any additional similarities or unique attributes that have not been included.
  6. Use the Venn Diagram for further analysis, writing, discussion, or study, utilizing the clear visual comparison it provides.

Obtain Answers on Venn Diagram Graphic Organizer

  1. What is a Venn Diagram Graphic Organizer?

    A Venn Diagram Graphic Organizer is a tool used to compare and contrast two or more items, ideas, or concepts. It consists of overlapping circles, each representing a different set of characteristics or aspects. Where the circles overlap, similarities are listed; in the non-overlapping parts, differences are noted.

  2. How do you fill out a Venn Diagram Graphic Organizer?

    To fill it out, start by identifying the items or concepts you're comparing. Write each one in a separate circle. Then, in the overlapping section(s), jot down the similarities between them. In the outer parts of the circles, write the unique characteristics or aspects that set them apart from each other.

  3. Can I use a Venn Diagram for more than two items?

    Yes, you can use a Venn Diagram to compare and contrast more than two items. However, as the number of items increases, the diagram and its overlaps might become more complex. Each item is represented by a circle, and their similarities and differences are noted in the same way as with two items.

  4. Is there specific software needed to create a Venn Diagram Graphic Organizer?

    No specific software is needed to create a Venn Diagram. They can be drawn by hand or created using general-purpose programs like word processors and presentation software, which often include templates or drawing tools for Venn Diagrams. Online graphic organizer tools also offer the capability to create them digitally.

  5. Who can benefit from using a Venn Diagram Graphic Organizer?

    Anyone looking to visually organize information can benefit from using a Venn Diagram Graphic Organizer. They are widely used in educational settings, from elementary through college, to facilitate learning and comparison tasks. Professionals in various industries also use these organizers for decision-making, planning, and presentations.

  6. What subjects or topics are suitable for a Venn Diagram?

    Venn Diagrams are versatile and can be used for a wide range of subjects and topics, including literature, science, social studies, and mathematics. They are perfect for comparing characters, historical events, scientific concepts, mathematical sets, or any other items that have both shared and distinct characteristics.

  7. Can Venn Diagrams help improve critical thinking?

    Yes, Venn Diagrams can help improve critical thinking by encouraging the analysis of how and why items are similar or different. This kind of comparative analysis helps develop higher-order thinking skills, such as evaluation and synthesis, which are valuable in academic and real-world problem-solving scenarios.

  8. Are there limitations to using Venn Diagrams?

    Venn Diagrams are most effective when dealing with items that have clear similarities and differences. For very complex topics with nuanced or numerous attributes, or when there are more than three items to compare, they may become too simplified or cluttered to be useful. In such cases, alternative forms of organization might be more appropriate.

Common mistakes

Filling out a Venn Diagram Graphic Organizer can seem straightforward, but it's quite easy to slip up if you're not mindful. A Venn Diagram is a powerful tool used to visually represent the similarities and differences between two or more items, ideas, or concepts. Here, we will guide you through common pitfalls to avoid so that you can make the most of this organizer. With attention to detail, you can ensure your Venn Diagram is both informative and effective.

  1. Not clearly defining the purpose of the Venn Diagram before starting. This is crucial because it guides what information you will include and how you will structure it.

  2. Omitting titles for each circle or section. Titles are essential as they identify what each part of the diagram represents, making the diagram understandable at a glance.

  3. Using too many categories. Although it's possible to create a Venn Diagram with more than two circles, complexity increases significantly with each addition, often leading to confusion.

  4. Overcrowding the diagram with too much information. A cluttered diagram can be overwhelming and difficult to follow, undermining its purpose of simplifying the comparison.

  5. Ignoring differences by focusing only on similarities. Both similarities and differences are valuable for a comprehensive analysis, and neglecting one diminishes the effectiveness of the diagram.

  6. Writing in inconsistent levels of detail for compared items. Consistency is key to a fair and balanced comparison, so make sure to describe each item with a similar level of detail.

  7. Using vague language instead of being specific. Vague language can cloud the intended meaning, whereas specific descriptions clarify how the items are similar or different.

  8. Not revising or editing the diagram. Revisiting your work to correct mistakes or refine descriptions ensures the final product is as clear and accurate as possible.

  9. Failure to use visual cues, such as different colors or patterns, to enhance readability and comprehension. Visual cues can help to quickly orient the viewer to the diagram's structure and contents.

  10. Forgetting to consider the audience. The diagram should be tailored to the knowledge and interests of its intended audience to ensure that it communicates effectively.

By steering clear of these common mistakes, you can create a Venn Diagram that is not only visually appealing but also a powerful tool for analysis and communication. Whether you're comparing literary themes, scientific concepts, or historical events, precision, clarity, and attention to detail are your best allies.

Documents used along the form

The Venn Diagram Graphic Organizer form is a useful tool for categorizing and comparing different elements. It is often utilized in educational settings to help students visually organize information. Aside from this diagram, there are several other forms and documents that are frequently used to enhance learning, organize data, or facilitate various processes in academic and professional settings.

  • T-Chart Graphic Organizer: This document helps in comparing two sides of a single topic or argument. It is structured with two columns, each representing opposing viewpoints or characteristics. It's a straightforward way to organize thoughts for essays or debates.
  • SWOT Analysis Template: Used primarily in business and marketing, this form helps in identifying Strengths, Weaknesses, Opportunities, and Threats related to a business or project. It's crucial for strategic planning.
  • KWL Chart: Standing for "Know, Want to know, and Learned," this form is utilized in educational settings to track students' learning progress. It encourages active engagement with the material before, during, and after the learning process.
  • Flow Chart: This document illustrates a sequence of steps in a process. It's used in various fields to map out the workflow of complex processes, making them easier to understand and follow.
  • Storyboard Template: Essential in film, television, and digital media production, this form outlines scenes visually to organize a story's flow. It helps creators convey their vision more effectively to the team.
  • Mind Map: This form is used for brainstorming ideas and organizing thoughts in a visually hierarchical manner. It is beneficial for planning projects, studying, and developing creative concepts.
  • Checklist: A simple yet effective form for tracking the completion of tasks or items. Checklists are used in a myriad of settings, from event planning to daily task management.
  • Project Timeline: This document provides a visual representation of the stages and deadlines of a project. It is crucial for project management, helping teams understand the sequence of tasks and time allocation.
  • Comparison Chart: Similar to the Venn Diagram, this form helps in comparing multiple items or concepts across various parameters. It is widely used for decision-making and analysis in both educational and professional contexts.

In summary, these documents, alongside the Venn Diagram Graphic Organizer, serve as vital tools for enhancing comprehension, facilitating smooth processes, and organizing information across different areas. They contribute to making learning and project management more structured and effective.

Similar forms

  • Comparison Chart: Similar to the Venn Diagram Graphic Organizer, a comparison chart is used to visualize the similarities and differences between two or more items, concepts, or ideas. However, it often presents in a table format rather than overlapping circles.

  • T-Chart: T-Charts are tools for examining two facets of a topic, such as pros and cons, facts vs. opinions, or similarities and differences. Like the Venn Diagram, it aids in organizing thoughts but does so through a two-column approach rather than overlapping areas.

  • Mind Map: Mind maps branch out from a central idea and explore various aspects of that idea. They share the Venn Diagram's goal of organizing information visually, making complex information more accessible, though mind maps may cover a broader range of topics without necessarily focusing on comparisons.

  • Flow Chart: Flow charts are used to depict processes or steps in a task, showing how one step leads to another, which is different from comparing items. However, both flow charts and Venn diagrams serve the purpose of breaking down information into simpler, visually understandable pieces.

  • SWOT Analysis: This tool is used to evaluate the Strengths, Weaknesses, Opportunities, and Threats related to a business or project. It resembles the Venn Diagram in its objective to analyze different components of a subject, but SWOT Analysis is more structured towards strategic planning.

  • Concept Map: Concept maps are graphical tools for organizing and representing knowledge. They link concepts and ideas with labeled arrows in a downward-branching hierarchical structure. Like Venn Diagrams, they help visualize relationships but are not limited to similarities and differences.

  • Spider Diagram: Also known as a radar chart or web diagram, this tool visualizes multivariate data in a way that resembles a spider's web. It shares the Venn Diagram's purpose of visual representation to simplify complex data, but it's more numerical and used for comparing multiple variables.

  • Fishbone Diagram: Used for identifying cause-and-effect relationships, the Fishbone Diagram helps with problem-solving by categorizing potential causes of problems to identify their root causes. Both this and the Venn Diagram help organize thoughts, though Fishbone Diagrams focus more on linear relationships.

  • Storyboard: Storyboards are sequences of drawings to visualize a narrative, often used in film and design. While primarily narrative rather than comparative or analytical, like the Venn Diagram, they help in pre-visualizing complex ideas or stories in a structured format.

Dos and Don'ts

When filling out the Venn Diagram Graphic Organizer form, it is essential to approach the task methodically to ensure clarity and effectiveness in illustrating the relationships between different sets of items, ideas, or groups. Here are some dos and don'ts to consider:

  • Do take the time to clearly understand the concepts or items you are comparing.
  • Do use concise and specific descriptions to label each circle of the Venn diagram to avoid confusion.
  • Do consider using colors or patterns to differentiate between the circles if you're filling out the form by hand or in a digital format that supports color.
  • Do list the similarities between the items in the overlapping section of the circles, ensuring these similarities are accurate and relevant.
  • Don't rush through filling out the organizer without carefully planning what information belongs in each section.
  • Don't overcrowd the diagram with too much text or too many details, as this can make it difficult to read and interpret the information.
  • Don't ignore the importance of neatness and legibility, especially if the organizer will be shared with others or used for presentation purposes.
  • Don't forget to review and double-check your work for errors or omissions, as the accuracy of the information is crucial for the effectiveness of the diagram.

By following these guidelines, you can maximize the utility of the Venn Diagram Graphic Organizer, making it a valuable tool for comparison and analysis. Remember, the goal is to visually represent similarities and differences in a manner that is straightforward and easy to understand.

Misconceptions

When it comes to understanding the Venn Diagram Graphic Organizer, several misconceptions tend to arise. Let's clarify these misconceptions to ensure everyone can effectively utilize this tool.

  • A common misconception is that Venn Diagrams are only used for comparing and contrasting two subjects. In reality, Venn Diagrams can accommodate multiple subjects, allowing for a more complex analysis of similarities and differences.

  • Another misunderstanding is that Venn Diagrams are solely appropriate for mathematical or scientific data. However, they are incredibly versatile and can be used in a variety of subjects including literature, history, and even art to organize and visualize relationships.

  • Some people assume that Venn Diagrams can only depict clear-cut similarities and differences. Nonetheless, they can also effectively represent nuanced relationships and partial overlaps between subjects, offering a more detailed perspective.

  • There's a viewpoint that suggests Venn Diagrams are too simplistic for advanced learners. On the contrary, they can support complex thought processes by simplifying and structuring the analysis of intricate relationships.

  • It's mistakenly believed that in a Venn Diagram, the area of overlap must always contain commonalities. In practice, the overlap can also highlight interesting contrasts or unexpected connections, expanding the diagram's analytical potential.

  • Lastly, the notion that Venn Diagrams are predominantly a teaching tool underestimates their utility. Beyond education, professionals across various fields use Venn Diagrams for problem-solving, decision-making, and clarifying complex systems.

By demystifying these misconceptions, individuals can leverage the Venn Diagram Graphic Organizer more effectively, enhancing their analytical, organizational, and decision-making skills across diverse contexts.

Key takeaways

The Venn Diagram Graphic Organizer form is a versatile tool designed to help users visually organize information by identifying similarities and differences between two or more subjects. When properly utilized, it can serve as an invaluable asset for both education and professional tasks. Below are five key takeaways to ensure effective filling out and usage of the Venn Diagram Graphic Organizer form.

  • Understand the purpose: Before beginning, it's crucial to clearly define the goal of the Venn Diagram. Knowing whether it's for comparing historical events, literary characters, scientific concepts, or any other subjects will guide how to best organize the information.
  • Identify the subjects: Clearly label each circle (or set) of the Venn Diagram with the subjects being compared or contrasted. This step will ensure that all relevant information is correctly categorized, enhancing the organizer's clarity and effectiveness.
  • Detailed analysis: When filling out the areas of overlap, it's important to think critically about the subjects' similarities. Conversely, the unique attributes of each subject should be filled into the non-overlapping parts of the circles. This thorough analysis will provide a comprehensive understanding of the subjects.
  • Keep it readable: While it might be tempting to include as much information as possible, prioritizing readability is key. Use concise descriptions or keywords to prevent overcrowding of text, which can make the diagram hard to follow.
  • Review and revise: After completing the diagram, take time to review and ensure that all information is accurate and placed correctly. It may be necessary to revise or rearrange items for improved clarity or accuracy.

Effectively utilizing the Venn Diagram Graphic Organizer form can simplify complex comparisons and highlight nuanced relationships between subjects. By following these key takeaways, users can maximize the benefits of this powerful visual tool.

Please rate Blank Venn Diagram Graphic Organizer PDF Template Form
4.5
Incredible
16 Votes